

A good operations dashboard for a construction materials testing lab helps team members to:
- Plan ahead based on workload
- Prioritize specific tasks as needed
- Avoid distractions caused by continuous paperwork flow
BreakTest’s Dashboard Shows Your Workload Overview in Real-time
Due to variability in the stage and pace of construction, some projects will have extended periods with busy concrete pours or vice versa, which will reflect in your laboratories workload. Scheduling a work day is easier with knowledge of what tests are in the queue for processing.
Examples of helpful real-time info are:
- Newly created test reports
- Notification of deficient test reports
- New age results on concrete tests (i.e. 7-day, 28-day, etc.)
- Test reports in queue for distribution to customers
Knowledge of such info helps to schedule a work day effectively and controls disruptions caused by late discovery of heavy workloads.
The Dashboard Lists Workload with Immediate Access to Tests Needing Attention
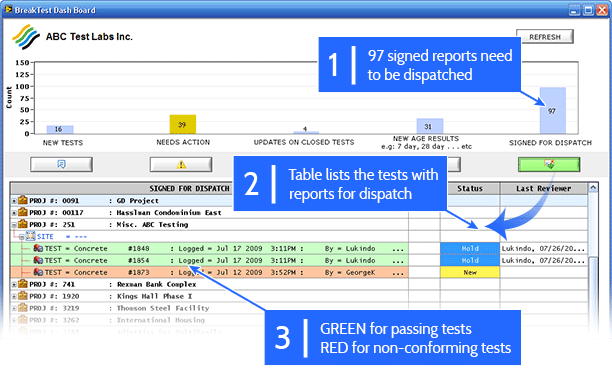
The Dashboard shows workload overview with direct access to tests. Non-conforming tests are highlighted for attention.
- A birds eye-view of your real time workload:
A bar chart shows the number of test sheets waiting processing. Buttons under each bar chart refreshes a table that lists test sheets under that specific bar that need some type of processing. - Tests listed on the table are grouped by project and site:
Info available for each test includes a summary of when test events were logged and users who reviewed the tests sheets at various stages. Double-clicking on a test row opens its test form. - Pass/fail colour coding for concrete tests:
This allows processing non-conforming tests in priority order for both the review and distribution stages.
By implementing BreakTest’s Dashboard in your materials testing processes, lab managers and engineers can help improve customer service — by prioritising their tasks based on workload or urgency, test reports can be consistently sent out on time.